One order, many clues
A single order could leave traces across sales, purchasing, production, delivery, invoicing, and payment. The dashboard helped turn those traces into a clearer review summary.
Turning scattered ERP transactions into structured business flow, data logic, and practical review views.
I mapped how sales, purchasing, production, delivery, invoicing, and payment data connect in Odoo, checked the logic behind the records, and turned the flow into practical review views that help teams review order progress, issues, insights, and follow-up points more clearly.
Public-safe case study built from real ERP analytics work.
The records were already inside Odoo. The challenge was reading them as one business case.
A single order could leave traces across sales, purchasing, production, delivery, invoicing, and payment. The dashboard helped turn those traces into a clearer review summary.
My role was to bridge the gap between operational reality and dashboard review, so scattered ERP records could become a clearer business story.
The work started from real operational questions across sales, purchasing, production, delivery, invoicing, and payment.
The output needed to make interpretation easier: progress visibility, issue signals, and follow-up points that could support review.
Before the dashboard could become useful, the process itself had to be understood. A case could begin from Sales Order or Internal Order, then move through BOQ, stock checking, purchasing, production, delivery, and invoice.
Mixed cases combine order, stock, purchase, and production logic. Why it mattered: each branch changes timing, control, and interpretation.
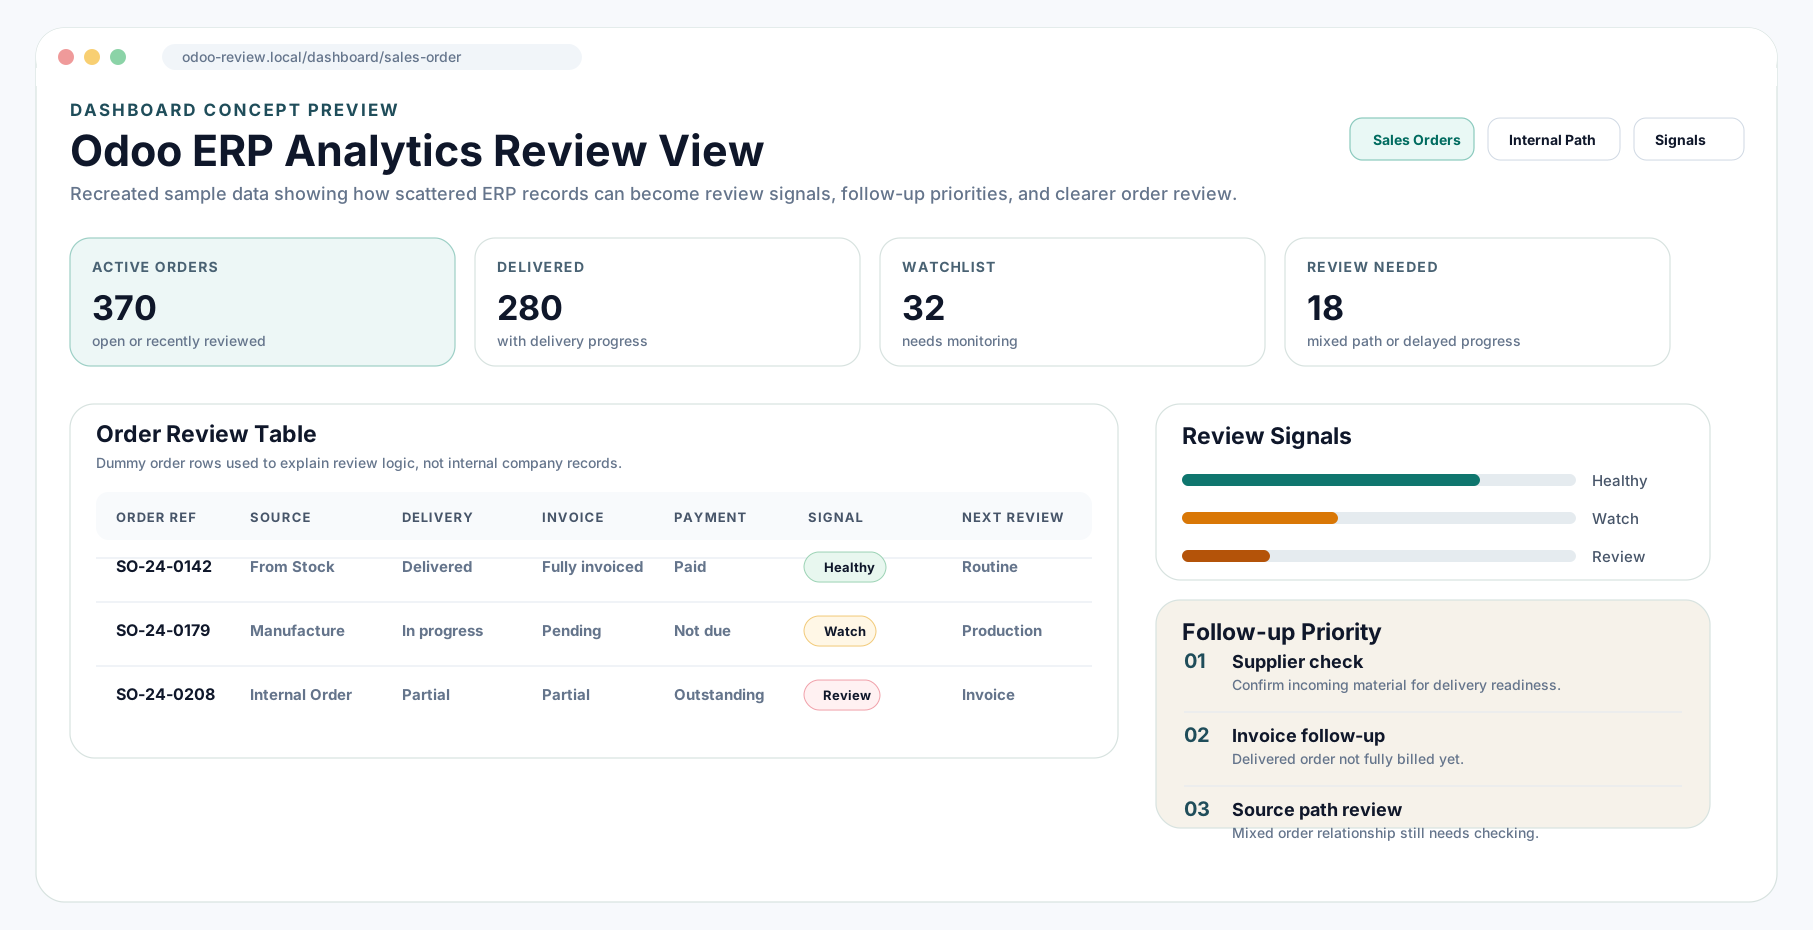
This preview uses dummy data to show how order status, source path, delivery progress, invoicing, payment, review signals, and follow-up priorities can be brought into one business-readable dashboard view.
Recreated dashboard concept preview using dummy data. The layout demonstrates the review logic without exposing internal company records.
See where each order stood: delivered, billed, delayed, waiting, or needing follow-up.
Highlight issues, unusual cases, and next actions without checking raw ERP menus one by one.
This section shows how my usual problem-solving pattern was applied in the Odoo dashboard project.
Progress review was mostly handled through weekly Excel reporting connected to the previous Scala ERP process.
As ERP PIC, I had access to the available data and could trace how records moved across sales, purchasing, production, delivery, invoicing, and payment. From there, the required columns, calculations, classifications, and review signals became clearer.
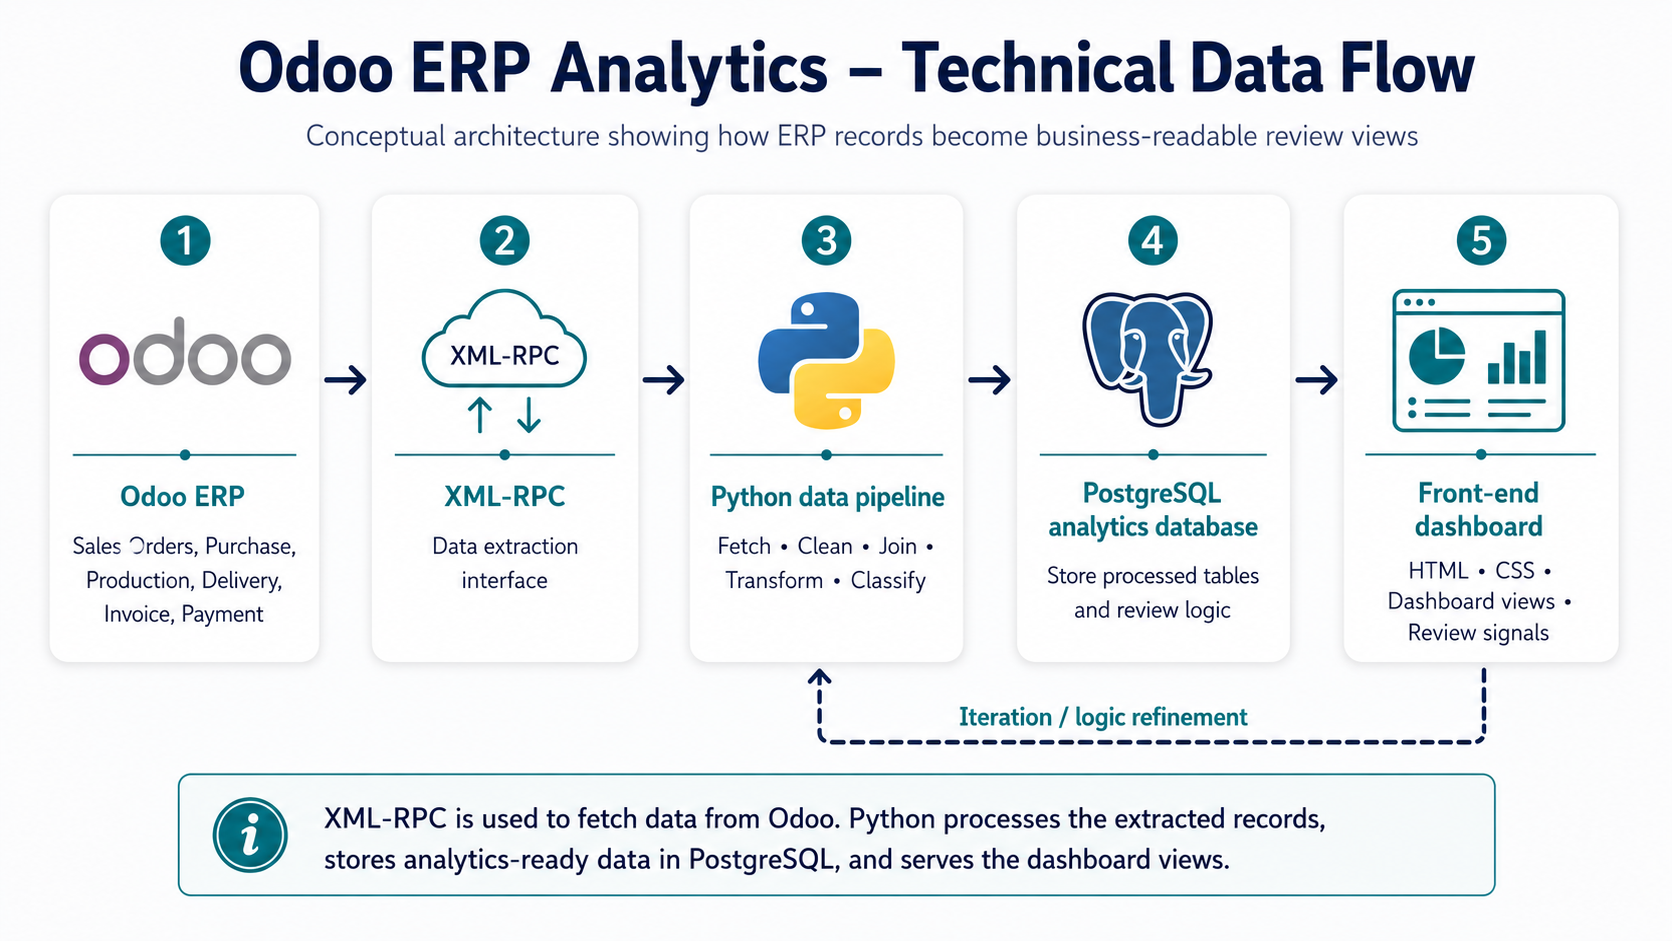
The reporting direction is moving toward a Python and PostgreSQL-backed web application that can pull ERP data and turn it into dashboard signals for progress, unusual cases, and data quality.
The build focused on interpreting ERP records, validating business rules, and turning them into reusable review logic.
A guided path showing how the project moved from ERP complexity into practical review outputs.
Sales, procurement, production, delivery, invoice, and payment records were connected in practice but difficult to review together.
The project mapped how SO, IO, PO, MO, DO, invoice, and payment records relate to each other.
Statuses, references, custom fields, and exceptions needed interpretation before becoming reporting logic.
Validated rules were translated into SQL views, dashboard outputs, and review signals.
The validated logic became dashboard views, review signals, and portfolio-ready examples.
The harder part was validating what each transaction meant in the business process before turning it into review logic.
The output turns ERP transaction logic into a readable table that supports order tracking, fulfillment review, invoicing context, payment follow-up, and profitability signals without requiring users to inspect raw ERP records one by one.
| Order Ref | Source Type | Delivery | Invoicing | Payment | Profitability Signal | Review Note |
|---|---|---|---|---|---|---|
| SO-24-0142 | From Stock | Delivered | Fully Invoiced | Paid | Healthy | Routine order, no exception follow-up. |
| SO-24-0179 | Manufacturing | In Progress | Pending | Not Due | Watchlist | Production and delivery progress under monitoring. |
| SO-24-0208 | Internal Order | Partially Ready | Partial | Outstanding | Needs Review | Linked procurement and invoice follow-up required. |
| SO-24-0241 | Purchase | Waiting Material | Not Invoiced | Not Due | Supplier Follow-up | Material availability affects delivery readiness. |
Material and Amount Order Tracking preview. Displayed labels and values are sanitized or recreated for explanation.
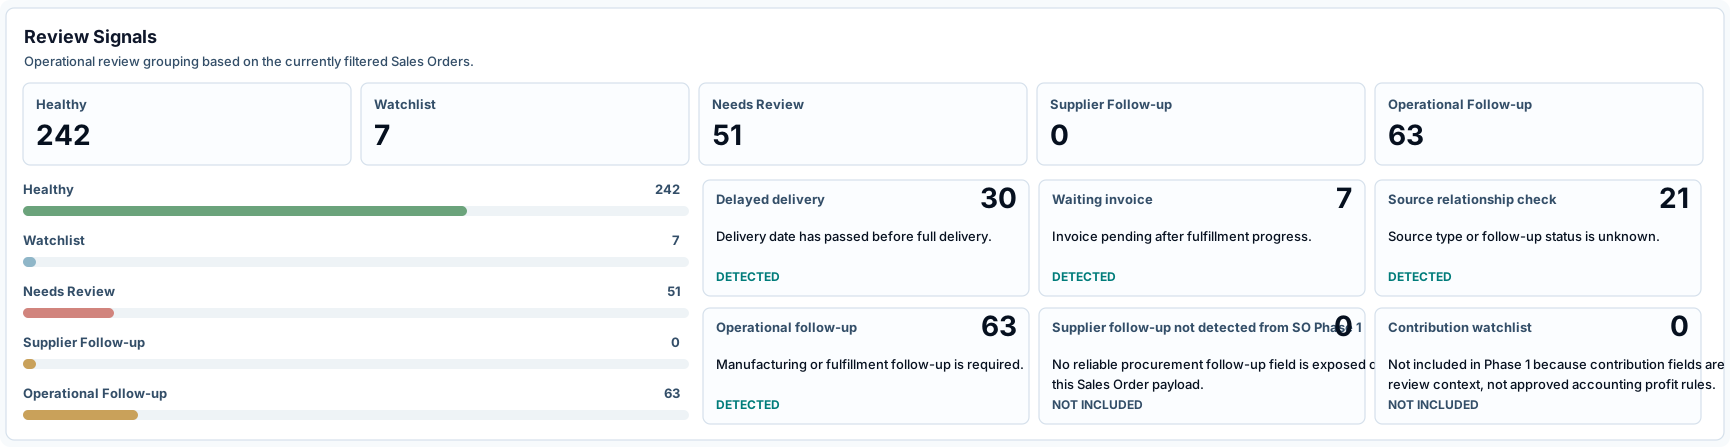
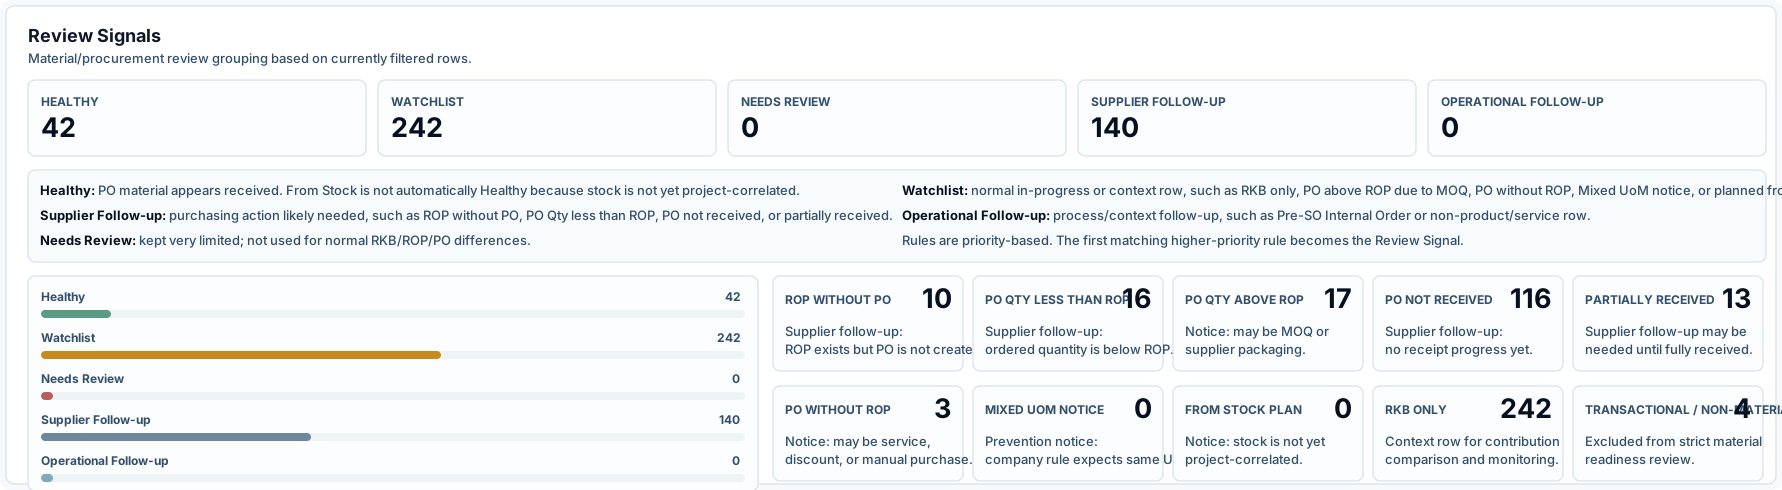
The dashboard groups filtered ERP rows into simple review indicators so users can distinguish normal records from items that may need delivery, invoice, procurement, source relationship, or material follow-up.
Groups sales order rows into review categories for delayed delivery, invoice follow-up, source relationship checks, and operational follow-up.
Groups material and procurement rows into review categories for monitoring PO progress, receipt status, and procurement follow-up.
Rows with no immediate follow-up detected from the exposed dashboard fields.
Normal in-progress or context rows that should be monitored until complete.
Rows with delayed, unclear, mismatched, or variance-related signals.
Procurement or receipt progress that may need supplier-side follow-up.
Fulfillment, manufacturing, source path, or internal process follow-up.
The project reduces repeated manual checking by turning scattered ERP records into reusable review views, helping teams understand what needs attention, what is progressing normally, and what requires follow-up more quickly.
This case study explains the project structure, business logic, and analytics approach without exposing customer names, supplier names, real order numbers, invoice values, profitability figures, database access details, server details, or confidential operational records.